
Kingston Market Insights
Real Estate Statistics, Trends & Local Perspective
Understand what's happening in the Kingston real estate market with monthly housing statistics, local market trends and practical insights for buyers, sellers and investors.
Better Decisions Begin with Better Information.
Whether you're purchasing your first home, preparing to sell or evaluating an investment property, understanding the local housing market helps you make informed decisions.
Kingston real estate market statistics provide useful context about pricing, sales activity, available inventory and changing buyer demand.
Why Local Context Matters
Kingston's housing market isn't one single market. Conditions can differ between neighbourhoods, property types and price ranges.
A regional market report provides valuable perspective, but a property-specific analysis is essential when setting a listing price or preparing an offer.
Kingston Real Estate Market Statistics & Trends
Explore monthly residential housing market graphics published by KAREA. These reports provide a snapshot of market activity across the association's reporting area.
Official Regional Market Statistics
Review the monthly graphics below for sales activity, pricing, inventory and market trends. Regional figures may differ from conditions in individual Kingston neighbourhoods.
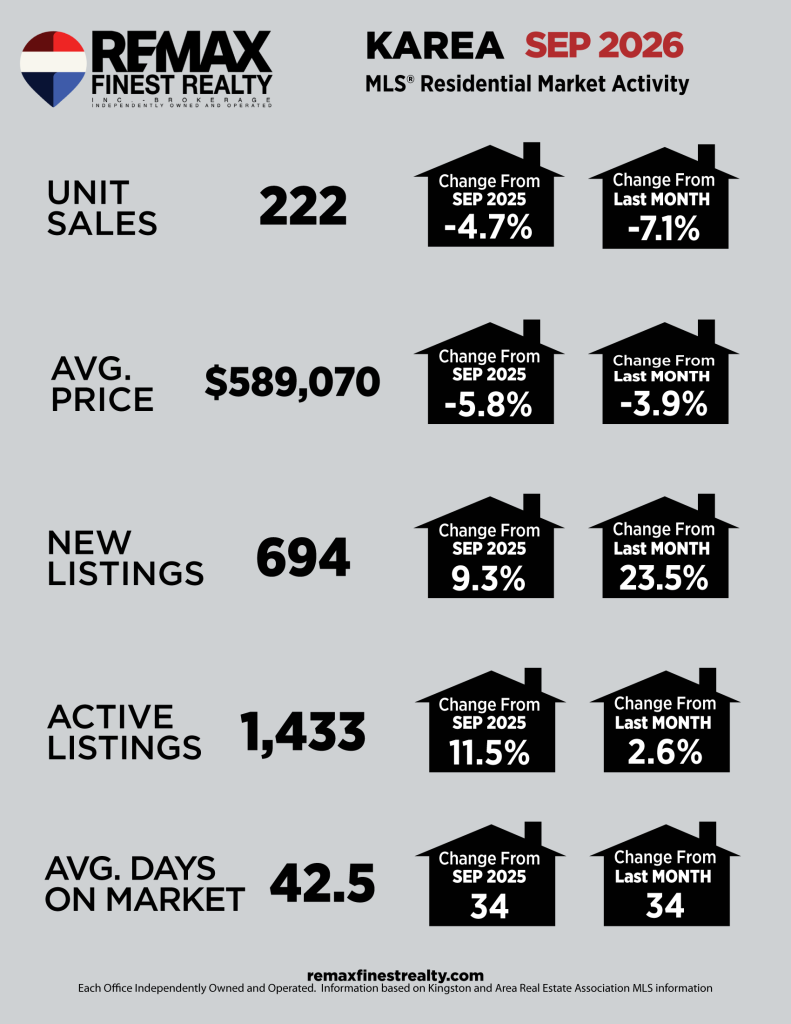
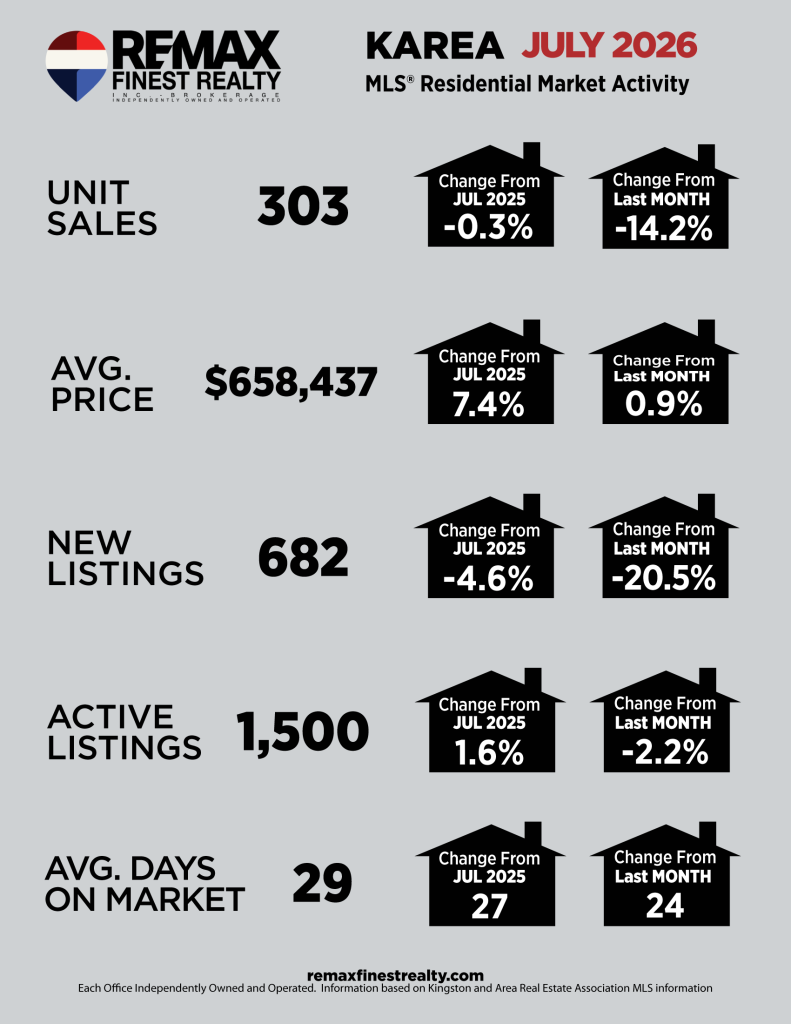

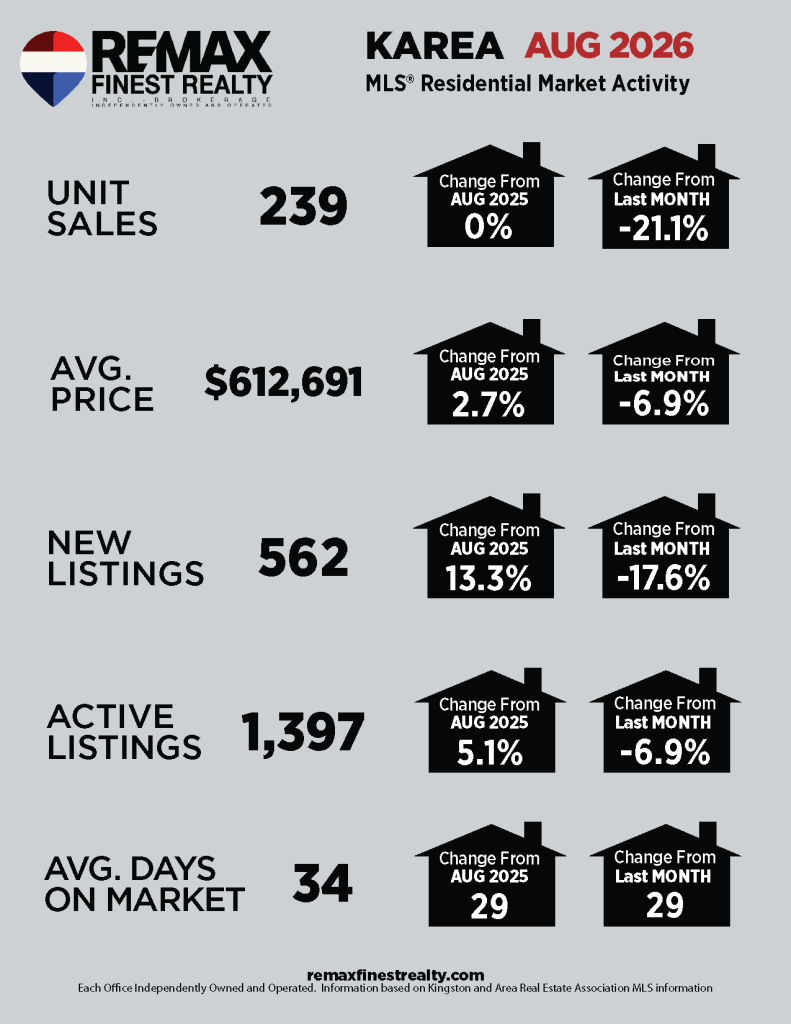


Kingston Real Estate Market Statistics: October 2026
October 2026 brought continued changes to the Kingston and area real estate market, with slower residential sales, lower prices compared with last year and more available housing inventory than historical norms.
Here's a closer look at the latest KAREA housing statistics and what they could mean for buyers and sellers in Kingston, Ontario.
Year-to-date sales: 2,403
YTD average: $615,595
Above 10-year average: 19.3%
Highest October level in a decade
Measures typical home price trends
Long-run October average: 3.6
October 2026 Kingston Real Estate Market Statistics
Residential sales across the Kingston and Area Real Estate Association reporting region totalled 223 in October 2026, down 9.3% from October 2025. Sales were 1.1% above the five-year average but 17.2% below the 10-year average for October. Year-to-date sales reached 2,403 units, a decrease of 6.9% compared with the first 10 months of 2025.
The average selling price was $571,928, decreasing 7.6% year over year. The more comprehensive year-to-date average price was $615,595, down 1.2% from the same period last year.
The MLS Home Price Index composite benchmark price was $534,000, down 1.7% from October 2025. The benchmark for single-family homes was $556,200 (-2.0%), townhouse and row units averaged a benchmark of $398,900 (-1.8%), and the apartment benchmark was $348,500 (-5.2%).
New residential listings totalled 556, down 8.7% from October 2025. However, new listings remained 19.3% above the 10-year average for October.
Active residential listings reached 1,311 at month-end, an increase of 6.8% year over year. October inventory was at its highest level for the month in a decade, standing 47.6% above the 10-year average.
Months of inventory increased to 5.9, compared with 5.0 in October 2025 and the long-run October average of 3.6 months. This indicates a market with more available supply relative to current sales activity.
The combination of subdued demand, elevated inventory and softer prices suggests that buyers may have greater negotiating opportunities, while sellers need to carefully consider pricing, property presentation and competing listings.
What This Means for Kingston Buyers
The October Kingston real estate market statistics show elevated housing inventory and softer prices compared with last year, providing buyers with more opportunities to explore Kingston and surrounding communities.
With 1,311 active listings and 5.9 months of inventory, some buyers may have more time to compare properties, negotiate price or conditions and complete appropriate due diligence.
However, well-priced homes in desirable neighbourhoods can still attract competition. Reviewing recent comparable sales and obtaining mortgage pre-approval remain important steps.
Search Kingston Homes for Sale
What This Means for Kingston Sellers
With active listings 47.6% above the 10-year October average, Kingston area sellers are competing for buyers who have a wider selection of properties.
Accurate pricing, professional presentation and a strong marketing strategy are especially important when inventory is elevated and sales activity is subdued.
Sellers should pay attention to recent comparable sales, current competing listings and the condition of their home. The MLS HPI benchmark provides useful market context, but regional average prices alone do not establish the value of an individual property.
Request a Kingston Home Valuation
What Does Today's Market Mean for You?
Every Kingston neighbourhood and property type can behave differently. Whether you're considering buying or selling, Jeff Ross can help you interpret local market conditions and develop a strategy for your next move.
Find Out What Your Home Is WorthSource: Kingston and Area Real Estate Association (KAREA), October 2026 residential MLS statistics. See CREA Statistics . Figures represent the KAREA reporting region, which includes communities outside the City of Kingston. Year-over-year comparisons refer to October 2025 unless otherwise noted.