
kingston market insights
Kingston Real Estate Market Statistics and Trends
Welcome to Kingston Market Insights, your resource for Kingston real estate market statistics, housing trends and monthly market reports for Kingston, Ontario and surrounding communities.
Understanding local market conditions is an important part of making informed real estate decisions. Whether you're buying your first home, preparing to sell or considering an investment property, market statistics can provide useful insight into housing activity, pricing and available inventory.
Below you'll find monthly housing market graphics published by the Kingston and Area Real Estate Association (KAREA). These reports provide a snapshot of residential real estate activity across the association's reporting area. Regional statistics may differ from conditions within individual Kingston neighbourhoods.
Market conditions can vary considerably depending on property type, location and price range. For buyers, reviewing current inventory and sales activity can help inform an offer strategy. For sellers, understanding comparable properties and local competition can help establish an appropriate asking price.
You can also explore Kingston homes for sale or request a Kingston home valuation for guidance specific to your property.
For additional information about the local real estate market and the association responsible for compiling these reports, visit the Kingston and Area Real Estate Association (KAREA) . Monthly market statistics provide a useful regional overview, but individual property values depend on location, condition, comparable sales and current buyer demand.




Kingston Real Estate Market Statistics: September 2026
September 2026 brought a wider selection of homes to the Kingston and area real estate market, alongside slower residential sales and a lower average selling price compared with last year.
Here's a closer look at the latest KAREA housing statistics and what they could mean for buyers and sellers in Kingston, Ontario.
Month over month: -7.1%
Month over month: -3.9%
Month over month: +23.5%
Month over month: +2.6%
Longer marketing periods than a year earlier
More available housing supply
September 2026 Kingston Real Estate Market Statistics
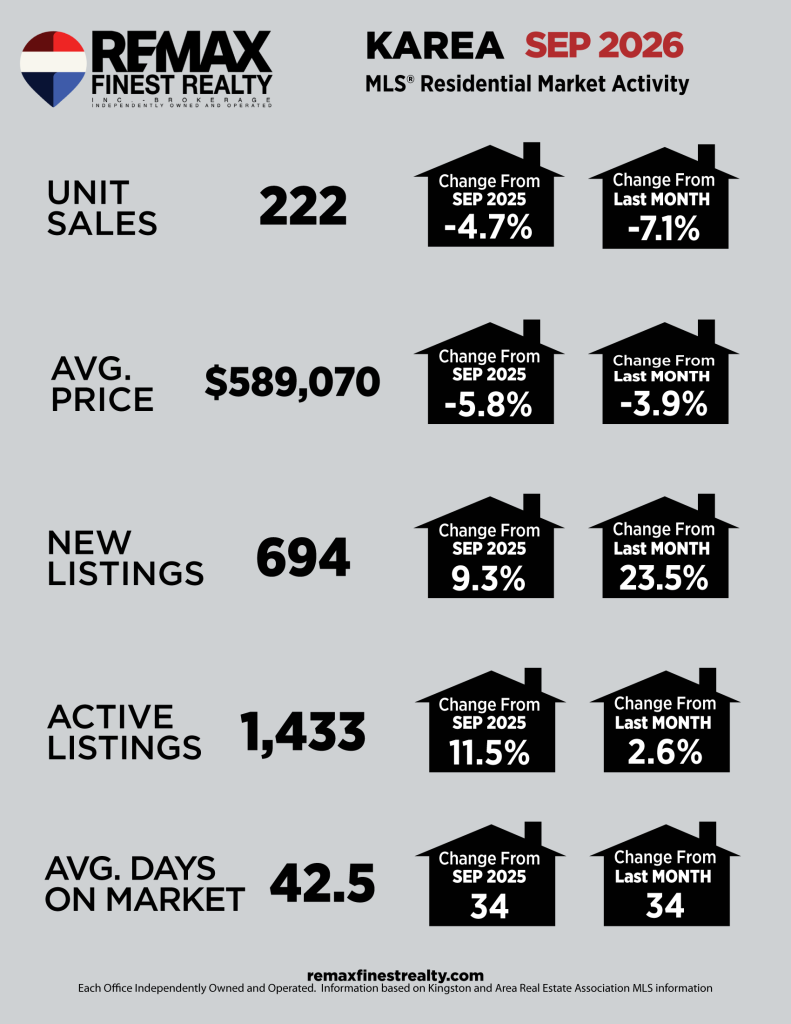
Residential sales across the Kingston and Area Real Estate Association reporting region totalled 222 in September, down 4.7% from September 2025 and 7.1% from August 2026.
The average selling price was $589,070, a decrease of 5.8% year over year and 3.9% month over month. Average prices can fluctuate depending on the types and locations of properties sold, so they should not be interpreted as a direct measure of the change in value of an individual home.
Meanwhile, 694 new listings entered the market, an increase of 9.3% from September 2025. Active listings reached 1,433, up 11.5% year over year.
Months of inventory increased to 6.5, compared with 5.5 a year earlier. Together, these figures suggest buyers had more available properties to consider, while sellers faced greater competition.
The MLS Home Price Index composite benchmark was $542,800, up 0.5% year over year. This illustrates why benchmark prices and average selling prices should be considered together when assessing housing trends.
What This Means for Kingston Buyers
The September Kingston real estate market statistics show increased housing inventory, giving buyers more properties to consider in Kingston and surrounding communities.
With sales activity lower than a year earlier and inventory levels higher, some buyers may have additional opportunities to compare properties, negotiate price or conditions, and complete appropriate due diligence.
However, well-priced homes in desirable neighbourhoods can still attract competition. Reviewing recent comparable sales and obtaining mortgage pre-approval remain important steps.
Search Kingston Homes for Sale
What This Means for Kingston Sellers
With 1,433 active listings across the association's reporting area, sellers are competing for buyers who may have more properties to choose from.
Accurate pricing, professional presentation and a strong marketing strategy are especially important when inventory is elevated.
Sellers should pay attention to recent comparable sales, current competing listings and the condition of their home. Regional average prices alone do not establish the value of an individual property.
Request a Kingston Home Valuation
What Does Today's Market Mean for You?
Every Kingston neighbourhood and property type can behave differently. Whether you're considering buying or selling, Jeff Ross can help you interpret local market conditions and develop a strategy for your next move.
Find Out What Your Home Is WorthSource: Kingston and Area Real Estate Association (KAREA), September 2026 residential MLS statistics, published through CREA Statistics . Figures represent the KAREA reporting region, which includes communities outside the City of Kingston. Days-on-market figures are reported separately and may use different measurement definitions.